Enterprise MIS · Healthcare
MFB MIS Ecosystem
Single engineer. Four applications. One million+ data points.
Data Pipeline
Data flows from field collection through management, monitoring, and analytics to web-based reporting — each application handling a distinct stage of the pipeline.
Shared Architecture
CIA Metadata System
Column Indicator Aggregator architecture mapping logical field names to generic physical columns. Forms, validation, and business logic are database-driven — new survey instruments deploy via configuration changes without code changes or recompilation.
Hierarchical Location System
Up to 8-level geographic hierarchy (District → Upazila → Union → Ward → CSG → Courtyard → Household → Child) with dynamic table name resolution and location-based access control across all applications.
Delta Sync Protocol
Timestamp-based differential synchronization where clients send last-known update timestamps per table and servers return only newer rows in password-encrypted ZIP files. Minimizes bandwidth for intermittent-connectivity environments.
WHO Growth Standards Engine
Gender-specific z-score classification for stunting (height-for-age), wasting (weight-for-height), and underweight (weight-for-age) using reference lookup tables with multi-level threshold classification.
Applications
Step 1 — Collection
Field Data Collection App
Full case studyOffline-first Android platform for field data collection across multiple health/sanitation projects. CIA architecture enables zero-code form deployment — new survey instruments go live from database configuration without recompilation.
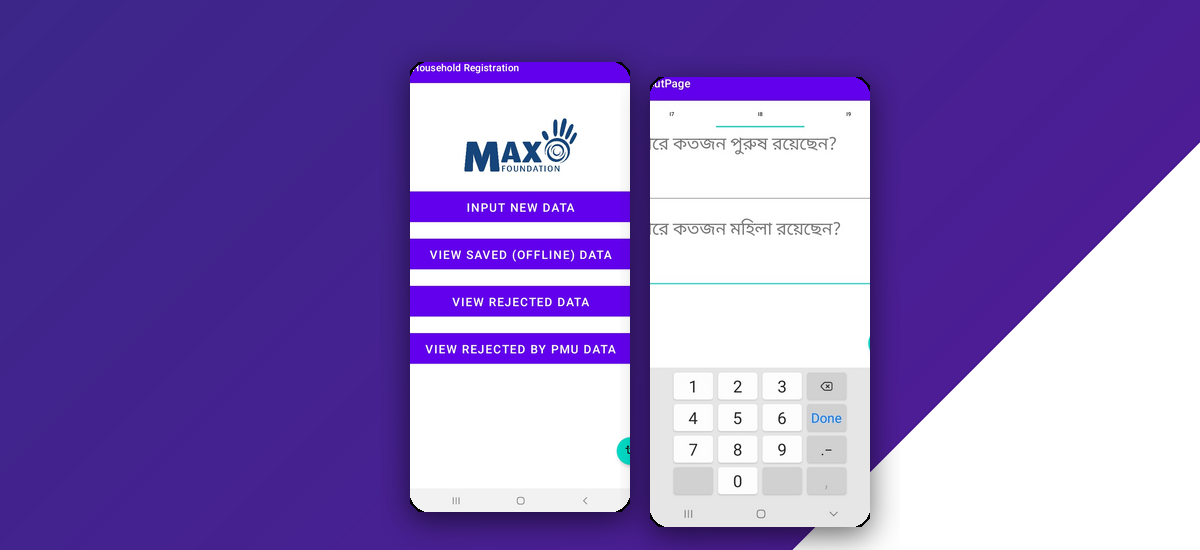
Challenge
Rapid survey updates without 2-week app store recompilation cycle.
Solution
CIA architecture mapping logical field names to generic database columns. Forms generate at runtime from MySQL configuration.
Challenge
3 separate codebases with growing technical debt.
Solution
Database-selection multi-tenancy — single APK serves all projects, switching by project database.
Step 2 — Management
Digital Evidence Centre
Full case studyDesktop data management hub that syncs field-collected data to local SQLite, with dynamic multi-join query building across 12+ dataset types and metadata-driven export with type-specific transformations.
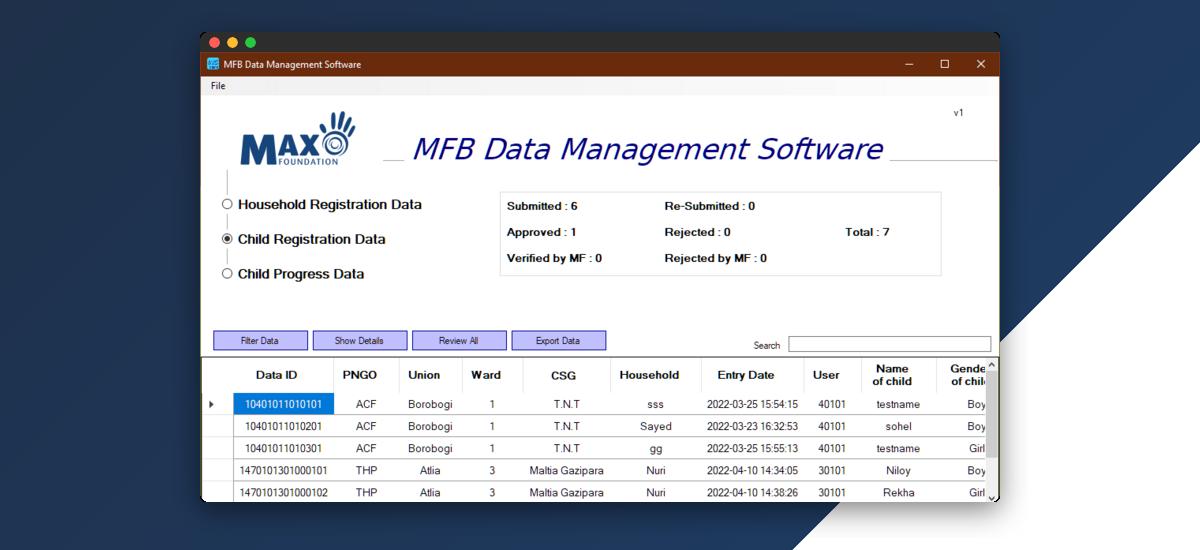
Challenge
Each dataset has a different hierarchical location path. Queries must dynamically join N location tables, N proxy data tables, and computed columns from server-defined metadata.
Solution
MyQuerries class reads form metadata (NodeForm, NodeLocPath, NodeLocTable) at runtime to build multi-JOIN SQL strings. Proxy location tables resolved via view creation. Composite IDs generated inline.
Challenge
Export columns are defined by server-side metadata — each may be a raw value, date, list, computed function, or image reference.
Solution
ExportHandler iterates NodeDbs export definitions, resolves to NodeCia, applies type-specific transformations in sequence via batch SQL UPDATE on temporary export tables.
Step 3 — Monitoring
Healthy Village Tracker
Full case studyDesktop MIS tracking 56 health program indicators across 6 geographic hierarchy levels with offline-first incremental sync and dynamic SQL view generation for multi-level aggregation.
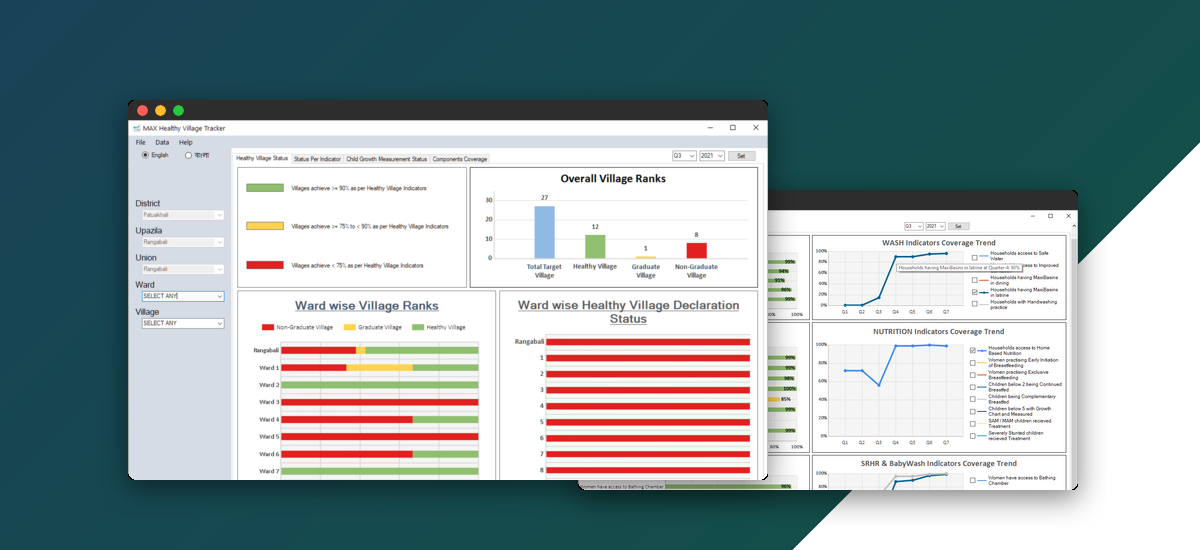
Challenge
Syncing large hierarchical datasets with minimal bandwidth.
Solution
Timestamp-based differential sync — client sends last update timestamp, server responds with only changed records in compressed ZIP.
Challenge
Aggregating data across 6 hierarchy levels with evolving logic.
Solution
Dynamic SQL view generation with SUBSTR grouping and validation against location tables.
Step 4 — Analytics & Reporting
Child Growth Dashboard
Full case studyCross-platform analytics combining a desktop application (C# WinForms) and web dashboard (PHP) implementing WHO Child Growth Standards, with z-score classification, multi-chart dashboards, and time-series trends for 10,000+ beneficiaries.
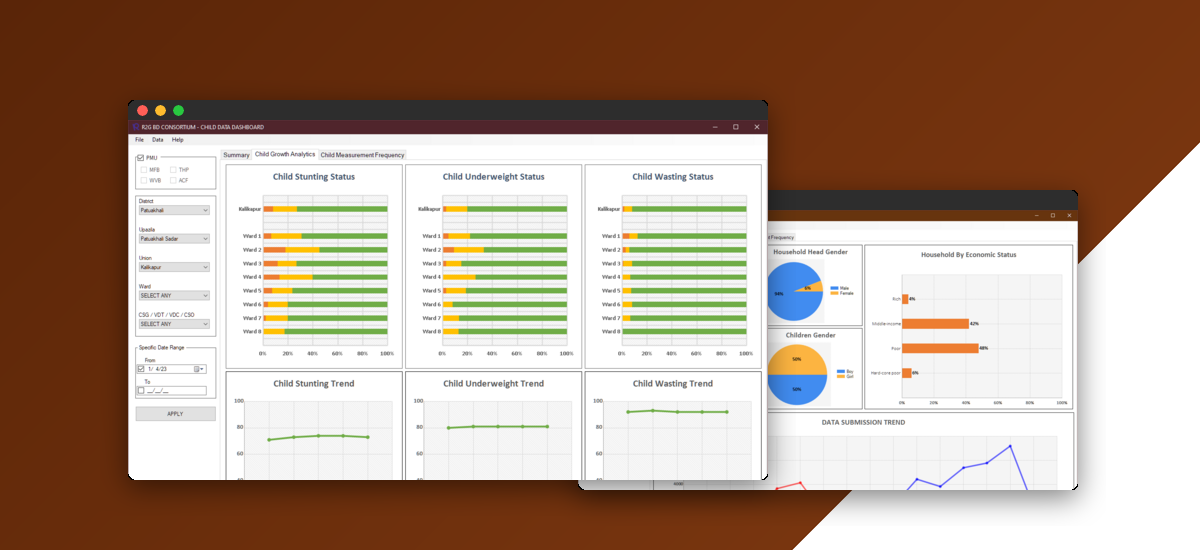
Challenge
WHO z-score calculation at scale across 100k+ child records.
Solution
Indexed SQLite lookup tables with age-in-months computation and gender-specific growth curves.
Challenge
10+ charts rendering without UI lag on low-spec hardware.
Solution
Pre-computed aggregates in SQLite views, chart inheritance hierarchy for shared rendering logic.
Challenge
Time-series aggregation without full table scans across 36+ months.
Solution
Bitwise month-frequency encoding (MF_2023 columns) where each digit represents month presence — O(1) lookups.
Challenge
Hierarchical org permissions without recursive CTE support.
Solution
Pre-computed hierarchy in org table, GROUP_CONCAT for recursive query, IN clause filtering.
Impact & Recognition
1M+
Field data records
125+
End users
8+
Partner organizations
183
Production releases
6+
Years of development
4
Applications
Publication
Democratising data insights for improved project monitoring and accountability
42nd WEDC International Conference · Sep 2021
Recognition
Top Ten Startup Award — Team Max TapWater
Youth Co:Lab Springboard 4.0, organized by UNDP · 2021