Desktop & Web Analytics
Child Growth Dashboard
WHO Child Growth Standards analytics across desktop and web — z-score classification, multi-chart dashboards, and time-series trends for 10,000+ beneficiaries.
This application is part of the MFB MIS Ecosystem — a suite of five cross-platform applications forming a complete data pipeline for health program monitoring.

Overview
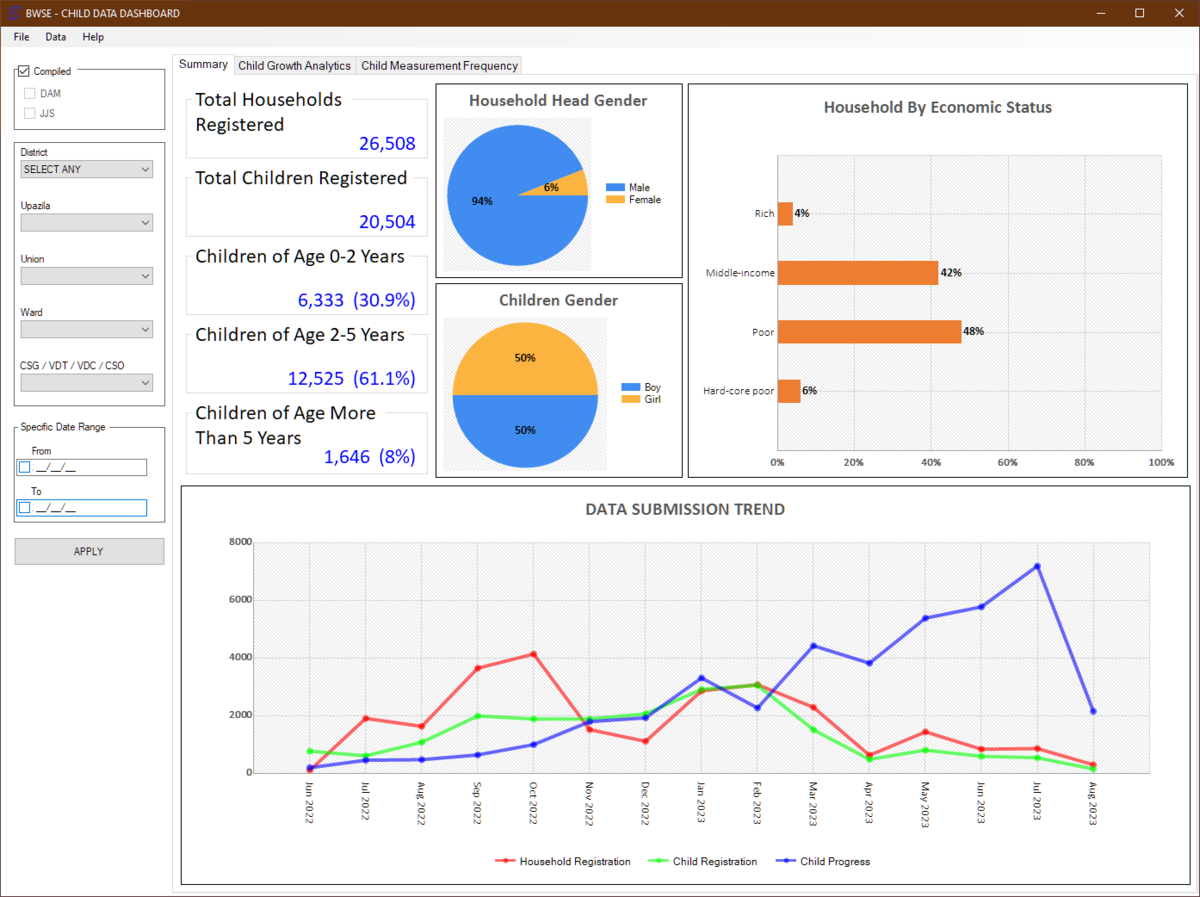
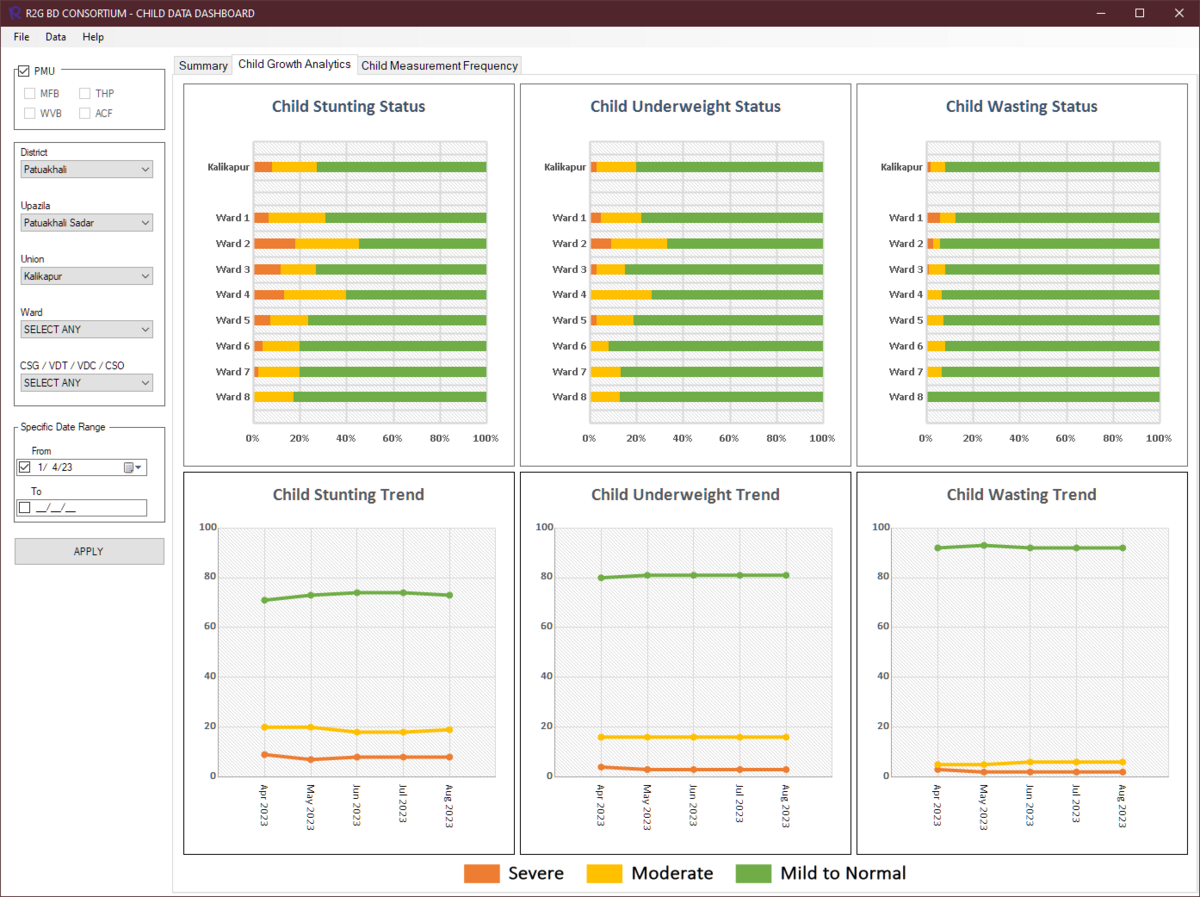
Cross-platform child nutrition analytics combining a desktop application (C# WinForms) and a web dashboard (PHP) to classify malnutrition using WHO Child Growth Standards.
The desktop application implements z-score calculation using indexed SQLite lookup tables, real-time multi-chart dashboards with 4-level organizational filtering, and multi-format export (PDF + Excel) with embedded chart images.
The web companion serves 10,000+ beneficiaries with hierarchical organizational filtering, time-series trend analysis, and bitwise month-frequency encoding that reduces query complexity from O(n*m) to O(1) for time-series aggregation.
Hard Problems
Challenge
WHO z-score calculation at scale across 100k+ child records.
Solution
Indexed SQLite lookup tables with age-in-months computation and gender-specific growth curves.
Challenge
10+ charts rendering without UI lag on low-spec hardware.
Solution
Pre-computed aggregates in SQLite views, chart inheritance hierarchy for shared rendering logic.
Challenge
Time-series aggregation without full table scans across 36+ months.
Solution
Bitwise month-frequency encoding (MF_2023 columns) where each digit represents month presence — O(1) lookups.
Challenge
Hierarchical org permissions without recursive CTE support.
Solution
Pre-computed hierarchy in org table, GROUP_CONCAT for recursive query, IN clause filtering.
Key Decisions
| Decision | Chose | Over | Because |
|---|---|---|---|
| Database access (desktop) | Raw SQLite | EF6 LINQ | Direct SQL control, explicit index usage, zero ORM overhead for analytical queries. |
| Time-series encoding (web) | Bitwise month columns | Normalized date ranges | O(1) complexity vs O(n*m) for date range scans. Critical for 10,000+ record dashboards. |